Substance use and drug addiction statistics in the US and worldwide: by age, gender, and ethnicity


Table of content
- What are the statistics of drug addiction in the US?
- What are the alcohol addiction statistics in the US?
- What are the opioid addiction statistics in the US?
- What are the heroin addiction statistics in the US?
- What are the marijuana addiction statistics in the US?
- What are the nicotine use statistics in the US?
- What are the cocaine addiction statistics in the US?
- What are the methamphetamine addiction statistics in the US?
- What are the hallucinogen use statistics in the US?
- What are the inhalant use statistics in the US?
- What are the statistics of drug use in the world?
- What are the alcohol addiction statistics in the world?
- What are the opioid addiction statistics in the world?
- What are the heroin addiction statistics in the world?
- What are the marijuana use statistics in the world?
- What are the nicotine addiction statistics in the world?
- What are the cocaine use statistics in the world?
- What are the methamphetamine use statistics in the world?
- What are the hallucinogen use statistics in the world?
- What are the statistics on drug addiction treatment in the US?
- What are the statistics on drug addiction treatment in the world?

Substance use and drug addiction statistics in the US and worldwide by age, gender, and ethnicity refer to data outlining patterns of substance use and addiction across various population groups.
In the US, alcohol and nicotine are the most prevalent substances, with notable addiction rates across various demographics, particularly among young adults and males. Marijuana and opioid addiction affect millions as well, with varying prevalence by age, gender, and ethnicity.
Other substances like cocaine, methamphetamine, and hallucinogens show lower but still concerning usage rates. Globally, cannabis leads as the most widely used drug, followed by opioids and alcohol, with addiction rates varying across age groups and regions.
What are the statistics of drug addiction in the US?
Statistics of drug addiction in the US refer to the numerical data and measurable trends illustrating the scope, patterns, and impact of substance use disorders across the United States (US). The statistics of drug addiction in the US are presented in the table below.
| Statistics of Drug Addiction in the US | ||
| Drug or drug category | Past year prevalence rate (% of population aged 12 or older | Estimated number of people |
| Alcohol | 10.2% | 28.9 million |
| Marijuana | 6.8% | 19.2 million |
| Cocaine | 0.4% | 1.3 million |
| Heroin | 0.2% | 587,000 |
| Methamphetamine | 0.6% | 1.8 million |
| Prescription pain reliever | 1.9% | 5.3 million |
| Opioid | 2.0% | 5.7 million |
| Central nervous system stimulant | 1.5% | 4.3 million |
Drug addiction affects a disproportionately large number of Americans (12 and up), according to the data. Having a clear understanding of each category allows for better treatment planning and more focused prevention initiatives.
What are the alcohol addiction statistics in the US?
Alcohol addiction statistics in the US refers to numerical data reflecting the prevalence, patterns, and demographic breakdowns of alcohol use disorder within the United States population. The alcohol addiction statistics in the US are shown in the table below.
| Alcohol Addiction Statistics in the US | ||
| Demographic group | Estimated number of people | Past year prevalence rate |
| Total (ages 12 and older)* | 28.9 million | 10.2% |
| By age group* | ||
| Ages 12-17 | 757,000 | 2.9% |
| Ages 18-25 | 5.1 million | 15.1% |
| Ages 26 or older | 23.0 million | 10.3% |
| By gender (ages 12 and older)ª | ||
| Male | 16.8 million | 12.1% |
| Female | 12.0 million | 8.3% |
| By race/ethnicityª | ||
| American Indian/Alaska Native | 156,000 | 11.6% |
| Asian | 994,000 | 5.7% |
| Black or African American | 3.3 million | 9.6% |
| Native Hawaiian/Pacific Islander | 88,000 | 7.9% |
| White | 18.7 million | 11.0% |
| Two or more races | 841,000 | 13.6% |
| Hispanic or Latino | 4.8 million | 10.8% |
ª Source: National Institute on Alcohol Abuse and Alcoholism (updated September 2024)
In the United States, alcohol addiction affects a wide range of people from different age groups, genders, and ethnic origins. Through identifying patterns, prevention and treatment initiatives on a national scale become more inclusive.
What are the opioid addiction statistics in the US?
Opioid addiction statistics in the US describe data measuring the extent and impact of opioid use disorder among the American population. The opioid addiction statistics in the US are indicated in the table below.
| Opioid Addiction Statistics in the US | ||
| Demographic group | Estimated number of people | Past year prevalence rate |
| Total (ages 12 and older)* | 5.7 million | 2.0% |
| By age group* | ||
| Ages 12-17 | 316,000 | 1.2% |
| Ages 18-25 | 396,000 | 1.2% |
| Ages 26 or older | 5.0 million | 2.2% |
| By genderª | ||
| Male | 2,697 | 1.9% |
| Female | 2,982 | 2.1% |
| By race/ethnicityª | ||
| American Indian/Alaska Native | 52 | 3.8% |
| Asian | 305 | 1.7% |
| Black or African American | 781 | 2.2% |
| White | 3,350 | 2.0% |
| Two or more races | 105 | 1.7% |
| Hispanic or Latino | 966 | 1.8% |
ª Source: SAMHSA, Center for Behavioral Health Statistics and Quality, National Survey on Drug Use and Health, 2022 and 2023
Regardless of a person’s age, gender, or race, opioid addiction is a public health problem in America today. The statistics indicate in order to solve the continuing problem, individualized plans for prevention, intervention, and therapy are needed.
What are the heroin addiction statistics in the US?
Heroin addiction statistics in the US reveal the extent and seriousness of heroin abuse across the country. The heroin addiction statistics in the US are outlined in the table below.
| Heroin Addiction Statistics in the US | ||
| Demographic group | Estimated number of people | Past year prevalence rate |
| Total (ages 12 and older)* | 587,000 | 0.2% |
| By age group* | ||
| Ages 12-17 | Data not available | Data not available |
| Ages 18-25 | 17,000 | <0.1% |
| Ages 26 or older | 570,000 | 0.3% |
Heroin addiction continues to be a prominent issue within the larger framework of opiate abuse in the United States. Comprehensive treatment strategies and targeted interventions are essential for overcoming the persistent obstacles associated with heroin addiction, as evidenced by statistics.
What are the marijuana addiction statistics in the US?
Marijuana addiction statistics in the US refer to the measured data showing how many individuals meet the criteria for cannabis use disorder within a specific timeframe. The marijuana addiction statistics in the US are presented in the table below.
| Marijuana Addiction Statistics in the US | ||
| Demographic group | Estimated number of people | Past year prevalence rate |
| Total (ages 12 and older)* | 19.2 million | 6.8% |
| By age group* | ||
| Ages 12-17 | 1.2 million | 4.7% |
| Ages 18-25 | 5.6 million | 16.6% |
| Ages 26 or older | 12.3 million | 5.5% |
| By genderª | ||
| Male | 11,380 | 8.2% |
| Female | 7,784 | 5.4% |
| By race/ethnicityª | ||
| American Indian/Alaska Native | 173 | 12.9% |
| Asian | 374 | 2.1% |
| Black or African American | 3,020 | 8.7% |
| White | 11,495 | 6.7% |
| Two or more races | 778 | 12.6% |
| Hispanic or Latino | 3,216 | 6.2% |
ª Source: SAMHSA, Center for Behavioral Health Statistics and Quality, National Survey on Drug Use and Health, 2022 and 2023
The prevalence rates of marijuana addiction vary significantly across different demographic categories in the United States. Changes in cannabis use patterns are reflected in the data.
What are the nicotine use statistics in the US?
Nicotine use statistics in the US describe data measuring the number of individuals dependent on nicotine-containing products such as cigarettes, e-cigarettes, and smokeless tobacco. The nicotine use statistics in the US are indicated in the table below.
| Nicotine Use Statistics in the US | ||
| Demographic group | Estimated number of people | Past month prevalence rate |
| Total (ages 12 and older)* | 64.4 million | 22.7% |
| By age group* | ||
| Ages 12-17 | 1.9 million | 7.4% |
| Ages 18-25 | 10.2 million | 30.0% |
| Ages 26 or older | 52.3 million | 23.4% |
| By genderª | ||
| Male | 37,305 | 26.9% |
| Female | 27,084 | 18.7% |
| By race/ethnicityª | ||
| American Indian/Alaska Native | 456 | 34.0% |
| Asian | 1,796 | 10.3% |
| Black or African American | 8,424 | 24.2% |
| White | 42,112 | 24.7% |
| Two or more races | 1,894 | 30.6% |
| Hispanic or Latino | 9,354 | 17.9% |
ª Source: SAMHSA, Center for Behavioral Health Statistics and Quality, National Survey on Drug Use and Health, 2022 and 2023
American citizens of all ages and ethnicities continue to struggle with nicotine use. Recent figures show diverse consumption patterns, illustrating how nicotine addiction is evolving in the population.
What are the cocaine addiction statistics in the US?
Cocaine addiction statistics in the US refer to the measured data on how many individuals meet the criteria for cocaine use disorder within one year. The cocaine addiction statistics in the US are specified in the table below.
| Cocaine Addiction Statistics in the US | ||
| Demographic group | Estimated number of people | Past year prevalence rate |
| Total (ages 12 and older)* | 1.3 million | 0.4% |
| By age group* | ||
| Ages 12-17 | 45,000 | 0.2% |
| Ages 18-25 | 189,000 | 0.6% |
| Ages 26 or older | 1.0 million | 0.5% |
Cocaine addiction impacted a significant portion of the US population, with over a million individuals meeting the criteria for the disorder. The data highlights the pervasiveness of stimulant-related substance abuse in all parts of the country.
What are the methamphetamine addiction statistics in the US?
Methamphetamine addiction statistics in the US refer to figures capturing the prevalence of meth use disorder among the population. The methamphetamine addiction statistics in the US are reported in the table below.
| Methamphetamine Addiction Statistics in the US | ||
| Demographic group | Estimated number of people | Past year prevalence rate |
| Total (ages 12 and older)* | 1.8 million | 0.6% |
| By age group* | ||
| Ages 12-17 | 23,000 | 0.1% |
| Ages 18-25 | 71,000 | 0.2% |
| Ages 26 or older | 1.7 million | 0.8% |
Methamphetamine addiction affected approximately 1.8 million individuals in the United States in 2023, with the highest prevalence observed among adults aged 26 and older. Statistics show how methamphetamine addiction continues to affect people of all ages across the country.
What are the hallucinogen use statistics in the US?
Hallucinogen use statistics in the US illustrate the scope of disordered use involving substances that distort perception and cognition. The hallucinogen use statistics in the US are detailed in the table below.
| Hallucinogen Use Statistics in the US | ||
| Demographic group | Estimated number of people | Past year prevalence rate |
| Total (ages 12 and older)* | 8.8 million | 3.1% |
| By age group* | ||
| Ages 12-17 | 387,000 | 1.5% |
| Ages 18-25 | 2.3 million | 6.7% |
| Ages 26 or older | 6.1 million | 2.7% |
| By genderª | ||
| Male | 5,294 | 3.8% |
| Female | 3,501 | 2.4% |
| By race/ethnicityª | ||
| American Indian/Alaska Native | 54 | 4.0% |
| Asian | 348 | 2.0% |
| Black or African American | 925 | 2.7% |
| Native Hawaiian/Pacific Islander | 5 | 0.4% |
| White | 5,692 | 3.3% |
| Two or more races | 267 | 4.3% |
| Hispanic or Latino | 1,505 | 2.9% |
ª Source: SAMHSA, Center for Behavioral Health Statistics and Quality, National Survey on Drug Use and Health, 2022 and 2023
In 2023, hallucinogen addiction impacted several people from various backgrounds, indicating a persistent issue with substance use patterns. Present data provide information about the prevalence of hallucinogen addiction and how it fits into the larger picture of drug abuse.
What are the inhalant use statistics in the US?
Inhalant use statistics in the US include information on the trends of inhalant usage in various age categories. The inhalant use statistics in the US are indicated in the table below.
| Inhalant Use Statistics in the US | ||
| Demographic group | Estimated number of people | Past year prevalence rate |
| Total (ages 12 and older)* | 2.6 million | 0.9% |
| By age group* | ||
| Ages 12-17 | 564,000 | 2.2% |
| Ages 18-25 | 694,000 | 2.0% |
| Ages 26 or older | 1.3 million | 0.6% |
| By genderª | ||
| Male | 1,711 | 1.2% |
| Female | 891 | 0.6% |
| By race/ethnicityª | ||
| American Indian/Alaska Native | 7 | 0.5% |
| Asian | 171 | 1.0% |
| Black or African American | 295 | 0.8% |
| Native Hawaiian/Pacific Islander | 2 | 0.2% |
| White | 1,520 | 0.9% |
| Two or more races | 73 | 1.2% |
| Hispanic or Latino | 534 | 1.0% |
ª Source: SAMHSA, Center for Behavioral Health Statistics and Quality, National Survey on Drug Use and Health, 2022 and 2023
Inhalant addiction continues to plague a portion of the population typically disregarded in broader substance use conversations. Highlighting such people raises attention to a significant yet underrecognized form of addiction requiring early help and awareness.
What are the statistics of drug use in the world?
Statistics of drug use in the world refer to information showing the prevalence, trends, and effects of substance use disorders—especially involving illicit drugs—around the world. The statistics of drug addiction in the world are presented in the table below.
| Statistics of Drug Use in the World | ||
| Drug or drug category | Estimated number of people | Prevalence rate (% of global adult population, aged 15-64) |
| Cannabis | 228 million | 4.3% |
| Opioids | 60 million | 1.1% |
| Amphetamines | 30 million | 0.6% |
| Cocaine | 23 million | 0.4% |
| Ecstasy | 20 million | 0.4% |
The numbers above reveal cannabis as the most extensively used drug globally, followed by narcotics and amphetamines. The rising prevalence highlights the need for all-encompassing public health approaches to address the global problems of drug use and addiction.
What are the alcohol addiction statistics in the world?
Alcohol addiction statistics in the world represent data related to the consumption and abuse of alcohol across global populations. The alcohol addiction statistics in the world are shown in the table below.
| Alcohol Addiction Statistics in the World | ||
| Demographic group | Estimated number of people with alcohol use disorder (AUD) | Prevalence rate |
| Total (ages 15 and older)* | 400 million | 7.0% |
| With alcohol dependence* | 209 million | 3.7% |
| By age groupª | ||
| Under-5s | Data not specified | <0.1% |
| Ages 5-14 | Data not specified | <0.1% |
| Ages 15-49 | Data not specified | 1.9% |
| Ages 50-69 | Data not specified | 2.0% |
| Ages 70 or older | Data not specified | 1.3% |
| By genderª | ||
| Male | 86.20 million | Data not specified |
| Female | 24.92 million | Data not specified |
ª Source: IHME, Global Burden of Disease (2024), with major processing by Our World in Data. Figures reflect the most recent available data from 2021 (based on estimates from 1990–2021).
Millions of people worldwide still suffer from alcohol addiction, with prevalence differing by age, gender, and location. The larger effect of long-term alcohol abuse on public health systems is better understood by looking at trends around the world.
What are the opioid addiction statistics in the world?
Opioid addiction statistics in the world refer to data quantifying the global impact of drug dependency involving opioids. The opioid addiction statistics in the world are outlined in the table below.
| Opioid Addiction Statistics in the World | ||
| Demographic group | Estimated number of people with opioid use disorder (OUD) | Prevalence rate |
| Total (ages 15–64)* | 30.1 million | 0.6% |
| By age groupª | ||
| Ages 15–25 (Adolescents and young adults) | Not specified | Higher risk, no specific rate |
ª Fang, et al., 2025. Data reflects estimates from 1990–2021
With different prevalence rates seen across populations, global statistics demonstrate the pervasiveness of opioid addiction. The data illustrate persistent obstacles in the global attempt to address opioid misuse and provide access to effective treatment.
What are the heroin addiction statistics in the world?
Heroin addiction statistics in the world refer to numerical data representing the global prevalence, patterns, and demographic breakdown of individuals diagnosed with heroin use disorder. The heroin addiction statistics in the world are reported in the table below.
| Heroin Addiction Statistics in the World | ||
| Demographic group | Estimated number of people with heroin use disorder (HUD) | Prevalence rate |
| Total (ages 15–64)* | 30.1 million | 0.6% |
| By age groupª | ||
| Ages 15–25 (Adolescents and young adults) | Not specified | Higher risk, no specific rate |
ª Fang, et al., 2025. Data reflects estimates from 1990–2021
Global heroin addiction figures highlight widespread usage trends, though detailed breakdowns by gender and ethnicity remain limited. The imperative necessity for global efforts to address heroin-related harm is still evident in the available data, despite the gaps.
What are the marijuana use statistics in the world?
Marijuana use statistics in the world refer to data measuring the prevalence and patterns of problematic marijuana use across global populations. The marijuana use statistics are indicated in the table below.
| Marijuana Use Statistics in the World | ||
| Demographic group | Estimated number of people | Prevalence rate |
| Total (ages 15–64)* | 228 million | 4.3% |
| By age group* | ||
| Ages 15–16 | 14,299 | 5.5% |
The rising prevalence of cannabis use is a major public health concern, especially among the younger generations. The lack of gender and ethnicity statistics emphasizes the need for more thorough worldwide research and monitoring.
What are the nicotine addiction statistics in the world?
Nicotine addiction statistics in the world refer to global data estimating the prevalence and impact of dependency on tobacco products, including cigarettes. The nicotine addiction statistics in the world are detailed in the table below.
| Nicotine Addiction Statistics in the World | ||
| Demographic group | Estimated number of people | Prevalence rate |
| Total* | Not specified | 23% |
| By age groupª | ||
| Ages 14–25 | Not specified | Nicotine addiction predominantly develops during this age window, no specific rate |
| Ages 26 or older | Data not available | Data not available |
| By gender* | ||
| Male | Not specified | 32% |
| Female | Not specified | 7% |
| By race/ethnicityª | ||
| White Non-Hispanic | Not specified | Highest levels of nicotine dependence among racial/ethnic groups, no specific rate |
ª Min et al. 2022
Though there is little ethnicity-specific data, the current numbers show the global prevalence of nicotine addiction. A more inclusive collection of demographic data sharpens tactics for lowering tobacco-related harm worldwide.
What are the cocaine use statistics in the world?
Cocaine use statistics in the world represent recorded figures capturing the extent of cocaine use globally. The cocaine use statistics in the world are presented in the table below.
| Cocaine Use Statistics in the World | ||
| Demographic group | Estimated number of people | Prevalence rate |
| Total (ages 15–64)* | 23 million | 0.4% |
The absence of demographic breakdowns in global statistics on cocaine use is a reflection of persistent difficulties in gathering and reporting data across national borders. Without insights into age, gender, or ethnicity, understanding the full scope of cocaine use worldwide remains limited.
What are the methamphetamine use statistics in the world?
Methamphetamine use statistics in the world refer to available data measuring the global impact of meth, an extremely addictive stimulant drug. The methamphetamine use statistics in the world are outlined in the table below.
| Methamphetamine Use Statistics in the World | ||
| Demographic group | Estimated number of people | Prevalence rate |
| Total (ages 15–64)* | 30 million | 0.6% |
Methamphetamine use is a developing worldwide issue with major social and medical consequences regardless of how comprehensive demographic breakdowns are lacking. Understanding the whole nature of the problem and guiding more successful actions internationally depend on enhanced information collecting.
What are the hallucinogen use statistics in the world?
Hallucinogen use statistics in the world refer to global estimates and patterns regarding the misuse and dependency on substances altering perception, mood, and cognition. The hallucinogen use statistics in the world are noted in the table below.
| Hallucinogen Use Statistics in the World | ||
| Demographic group | Estimated number of people | Prevalence rate |
| Total (ages 15–64)* | 20 million | 0.4% |
Global figures reflect the total extent of hallucinogen use without distinctions across age, gender, or ethnicity. Worldwide, expanded and comprehensive research is still needed due to the lack of comprehensive demographic data.
What are the statistics on drug addiction treatment in the US?
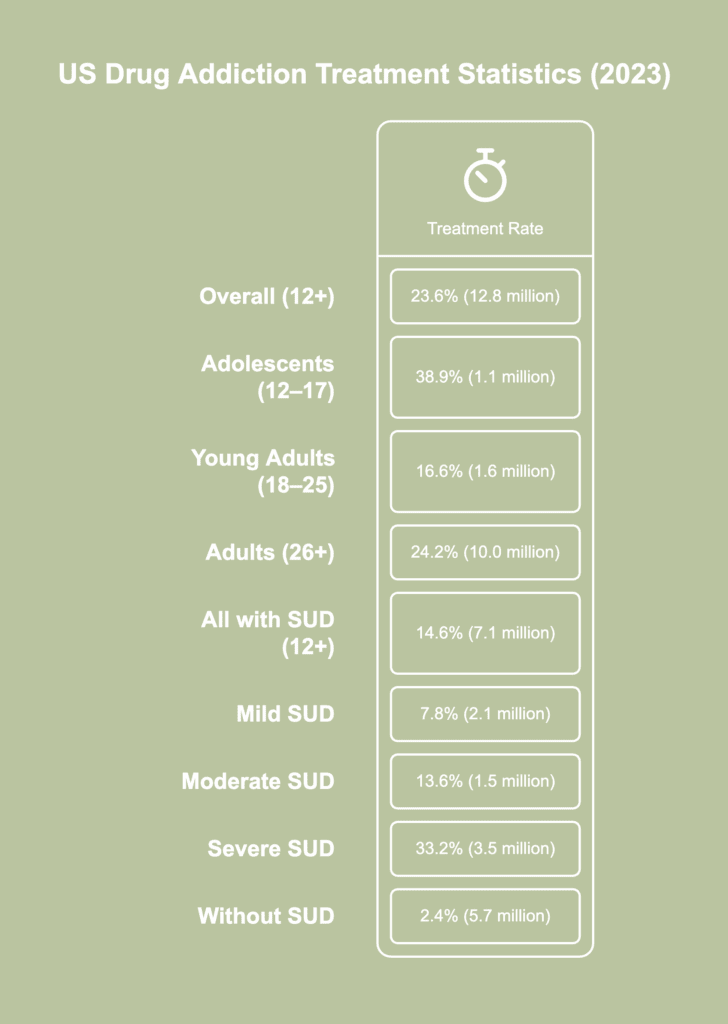
Statistics on drug addiction treatment in the US describe recorded figures reflecting how many people seek and receive care for substance dependency. The statistics on drug addiction treatment in the US are listed below.
- Overall treatment rate: Among individuals aged 12 and older in 2023 who needed substance use treatment, 23.6% (approximately 12.8 million people) received care in the past year, according to a 2024 publication titled “Key Substance Use and Mental Health Indicators in the United States: Results from the 2023 National Survey on Drug Use and Health” from the Substance Abuse and Mental Health Services Administration.
- Treatment among adolescents (12–17): 38.9% (roughly 1.1 million) of adolescents who needed treatment received help, marking the highest treatment rate among all age groups.
- Treatment among young adults (18–25): Young adults aged 18 to 25 recorded the lowest treatment rate, with just 16.6% (around 1.6 million) receiving support despite being in need of care.
- Treatment among adults (26 and older): A total of 24.2% (approximately 10.0 million) adults in this age range received treatment for substance use concerns.
- Treatment among all individuals with SUD: Out of 48.5 million people aged 12+ with a substance use disorder, only 14.6% (approximately 7.1 million) received treatment; 85.4% (about 41.4 million) received none.
- Treatment by SUD severity – mild cases: Among those with a mild SUD, only 7.8% (around 2.1 million) accessed treatment in the past year.
- Treatment by SUD severity – moderate cases: Just 13.6% (about 1.5 million) of individuals with moderate substance use disorders received care.
- Treatment by SUD severity – severe cases: Treatment was more common among individuals with severe SUD, with 33.2% (approximately 3.5 million) receiving help.
- Treatment among those without an SUD: 2.4% of people aged 12 or older without a substance use disorder (about 5.7 million) still received treatment for substance-related issues.
What are the statistics on drug addiction treatment in the world?

Statistics on drug addiction treatment in the world refer to compiled figures reflecting the extent to which individuals across various regions seek, access, or receive help for substance use disorders. The statistics on drug addiction treatment are listed below.
- Global treatment gap: Out of an estimated 64 million individuals worldwide living with drug use disorders, just 1 in 11 receives treatment, according to a 2024 press release from the United Nations Office on Drug and Crime, titled “UNODC World Drug Report 2024: Harms of world drug problem continue to mount amid expansions in drug use and markets.”
- Gender disparity in treatment access: Women face significantly reduced access to care, with only 1 in 18 receiving treatment for drug use disorders.
- Men’s treatment rate: Among men with drug use disorders, approximately 1 in 7 is currently in treatment.
